COVID-19 by the Center for Systems Science and Engineering at Johns Hopkins University
Johns Hopkins experts in global public health, infectious disease, and emergency preparedness have been at the forefront of the international response to COVID-19. This website is a resource to help advance the understanding of the virus, inform the public, and brief policymakers in order to guide a response, improve care, and save lives.
JHU has stopped collecting data as of 03 / 10 / 2023
Initial COVID-19 in New York City illustrates an exponential growth. Click through the tabs and see for yourself.
The first 5 days were unremarkable to many - only a few cases.
Perhaps 4 more cases each day than the day before.
The epidemiologists at the Public Health Department saw a very different progression of cases - an exponential growth of cases.
Day six brought more cases than expected from a simple linear growth pattern.
Perhaps a growth according to a power function (a quadratic equation)?
Perhaps an exponential growth?
Yes - an exponential !
New cases on day seven were definitely on the exponential curve!!
! ! Plague ! !
Remarkably - the first 5 days predicted the course of the COVID-19 epidemic over the next two weeks.
The Mayor was convinced, and within days the Governor was too. The city closed down!
The next month did slow the epidemic to a linear growth pattern - averaging 4,600 new cases a day!
Finally, a pause after two months.
Epidemics begin in one of three model independent ways.
- Exponential
- Power
- Linear
COVID-19 grew exponentially in New York City and Mississippi until Stay-in-Place orders were declared - despite the vast differences in population density.
NYC has tamed an exponential epidemic, first by slowing the new infections to a merely linear daily increase then ultimately lowering the new cases to ever smaller numbers.
Mississippi also entered a prolonged linear phase - averaging 266 new cases a day - but after three months - on the Fourth of July - the numbers of new cases again accelerated. With a 2 week delay - the time course of severe COVID-19 - deaths also accelerated.
Explore the striking similarities and important differences between NYC and Mississippi data in the COVID-19 menu to the right.
COVID-19 in Mississippi grew persistently for the first hundred days
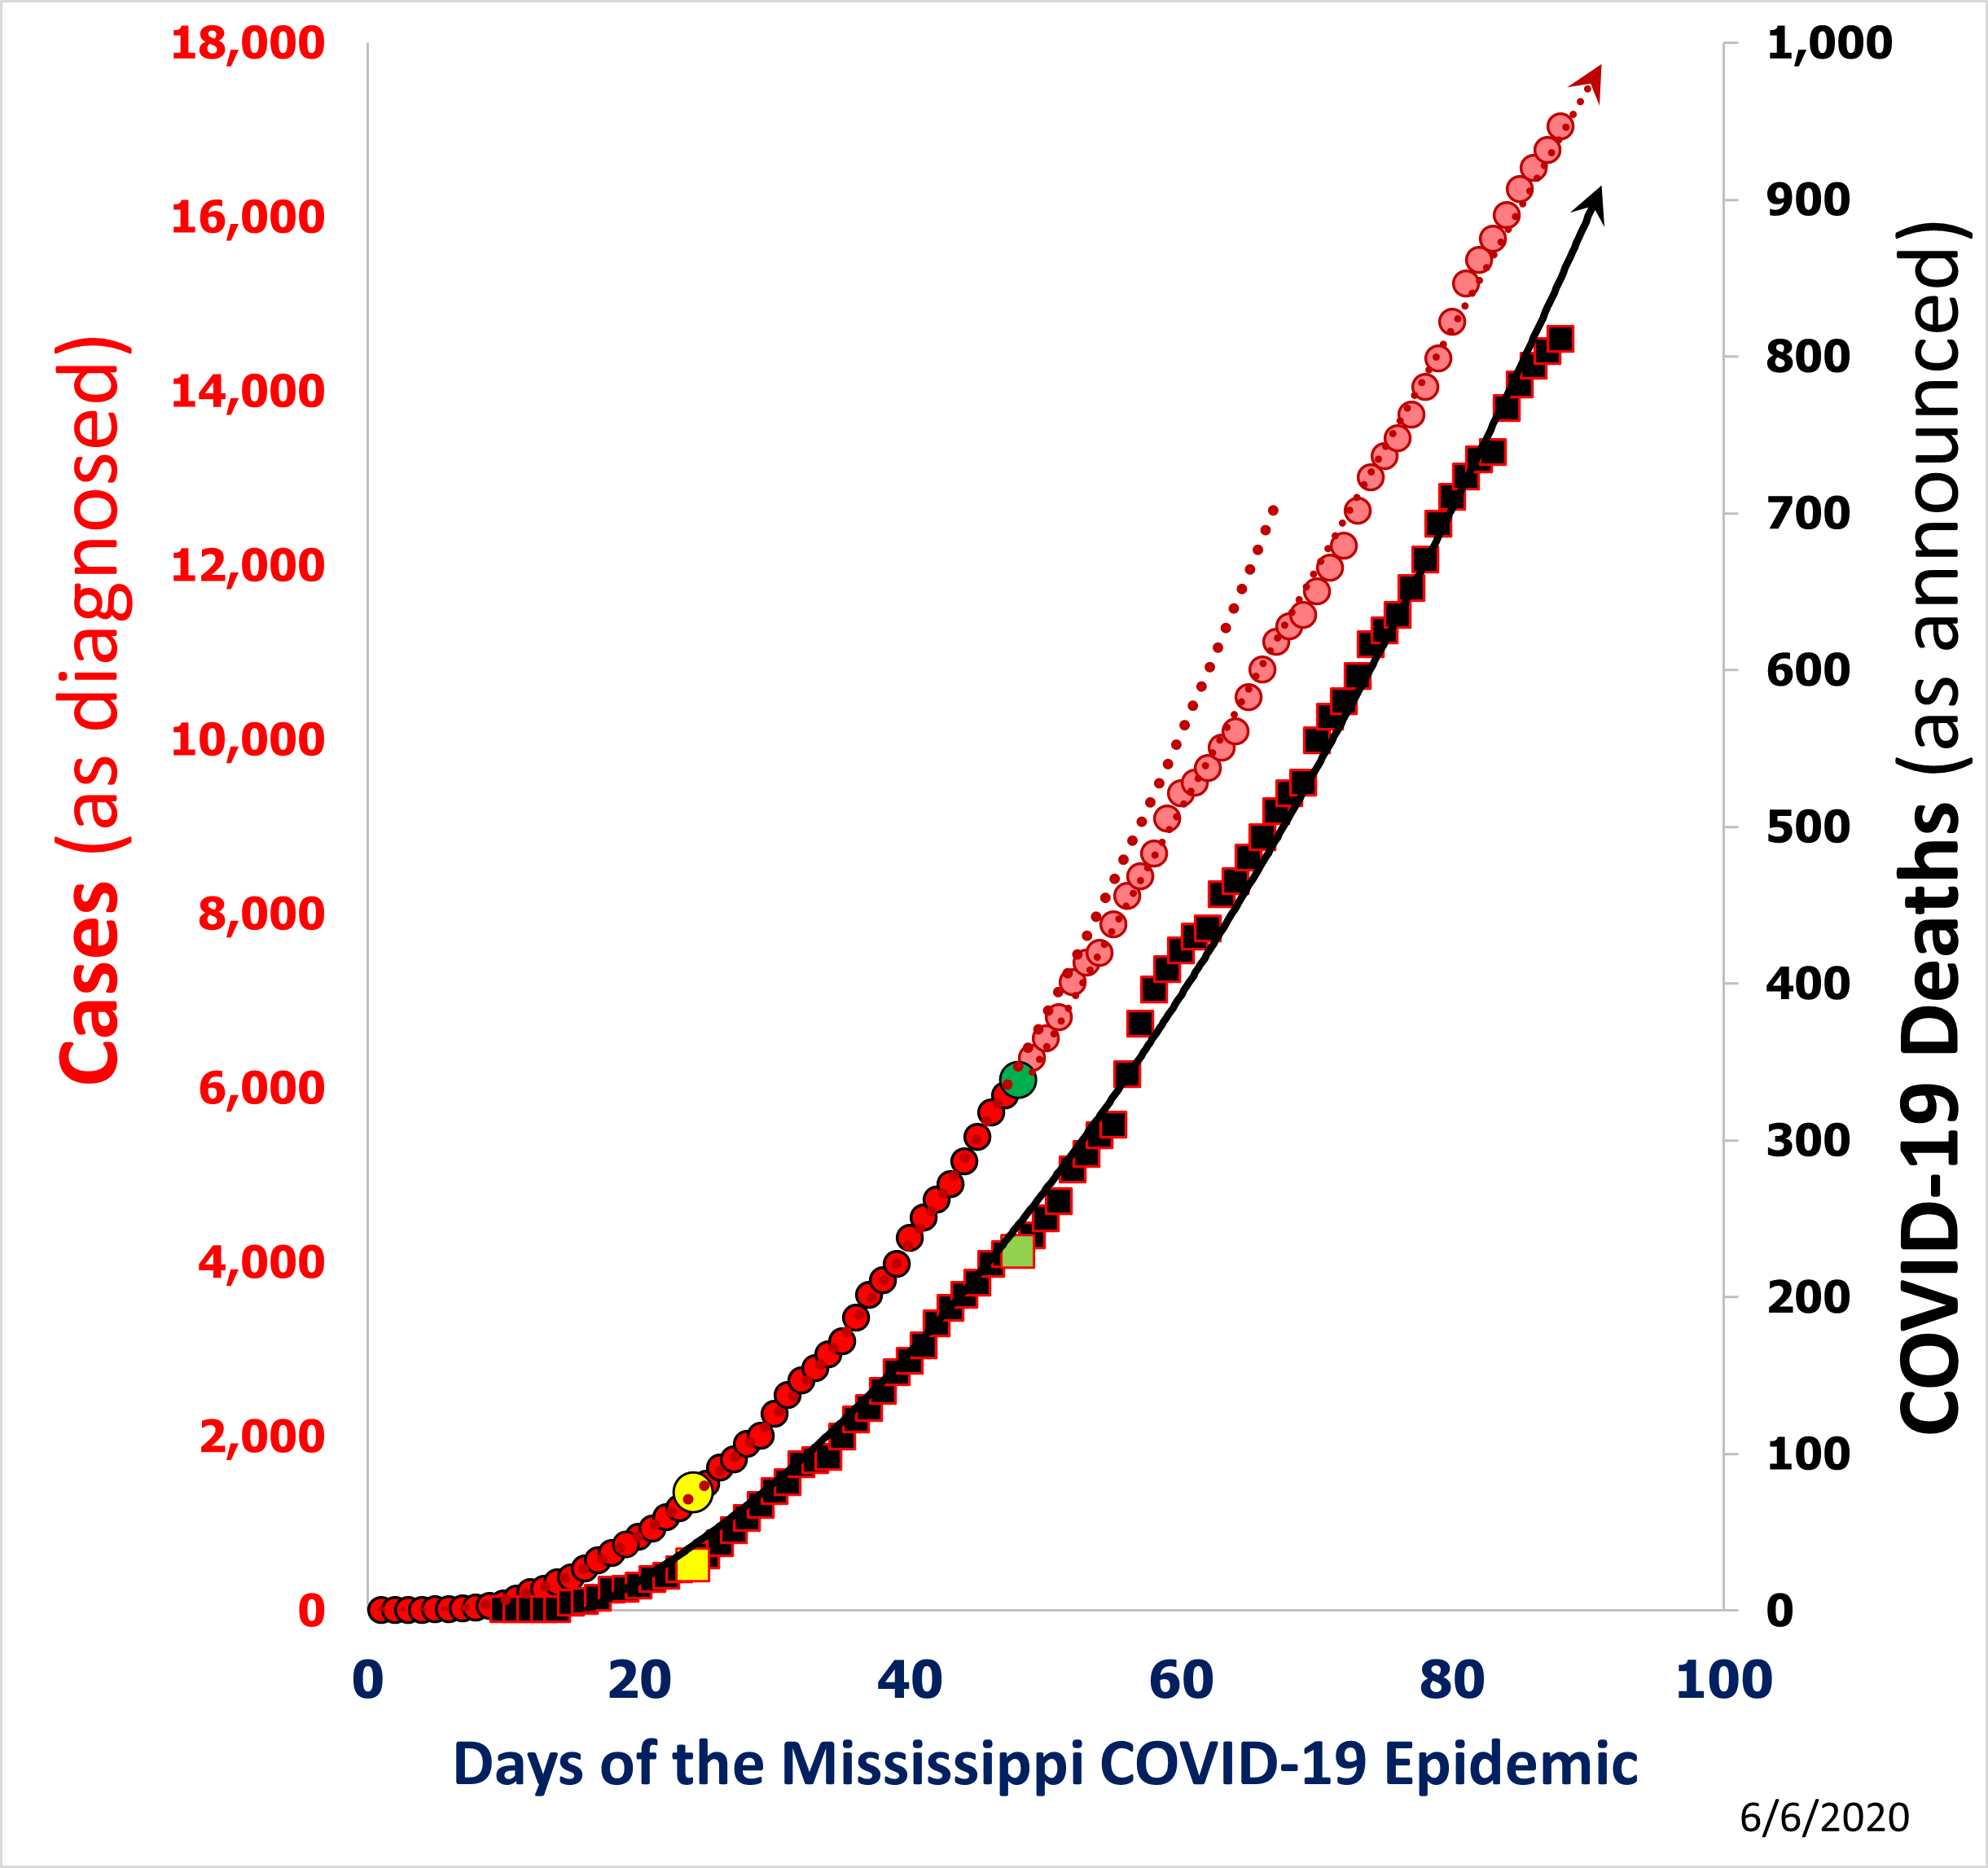
Cases and deaths have both grown persistently since March 11, 2020. (Data are the daily reports given by MSDH.)
Deaths lagged by 5 days - the latency between COVID-19's first symptoms and death.
The Stay-in-Place proclamation(yellow marker) arrested the exponential growth of the cases as announced daily, leaving a quadratic growth phase (the darker red dotted trendline) until the relaxation of the Stay-at-Home orders (green marker). Since that time, there has been a fairly steady report of 275 cases a day (the lighter data points and trendline).
Deaths have continued to grow quadratically.
This dichotomy between case reports and deaths is explored in the next tab.

The cumulative number of COVID-19 deaths grew exponentially for the first few days of the Mississippi epidemic, just as in New York City. This threat cannot be understated. Such an initial growth rate would point to 24 deaths a day on April 1, ∼10,000 deaths a day by May and millions a day shortly thereafter.
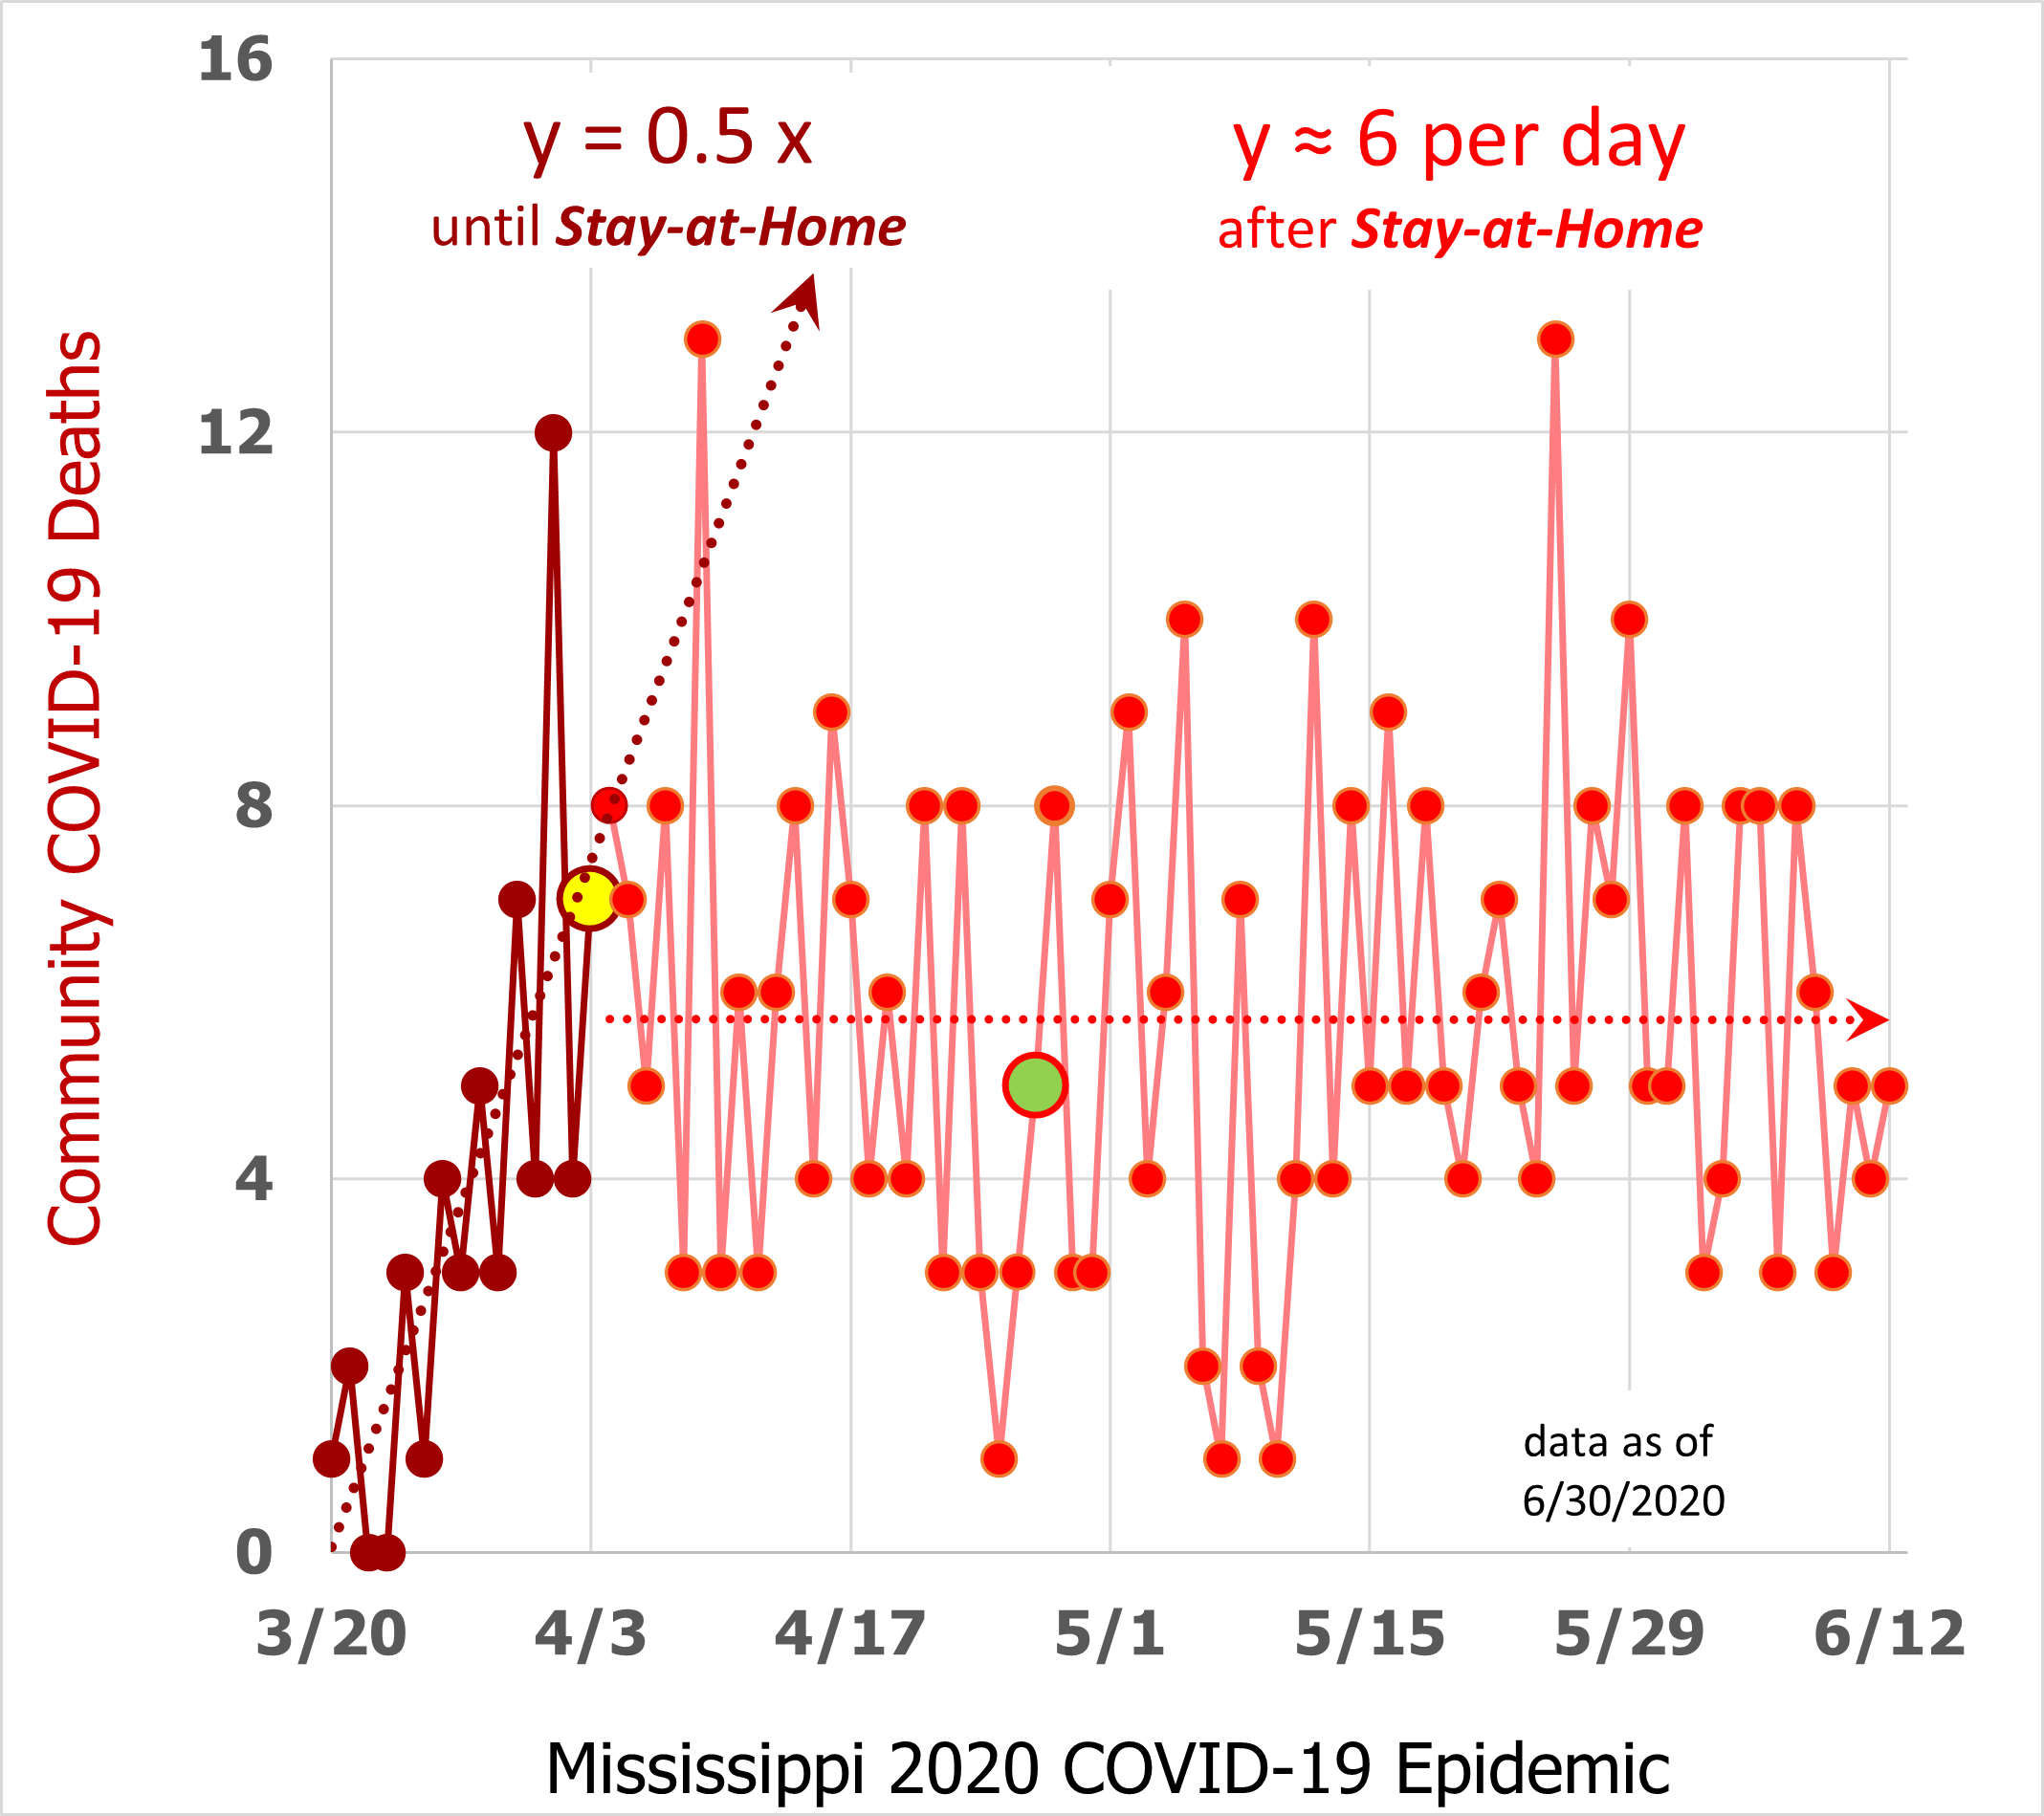
The mortality rate was arrested at 5/day when Stay-in-Place was ordered (left graph), causing deaths to accumulate linearly (right graph). These orders have had a lasting effect that has outlived subsequent orders (starting at the green dot) relaxing social distancing.
The per-capita number of community based COVID-19 Deaths is 12 per 100,000 thus far, which is near the median figure for the United States. This is less than a tenth of New York, so it is not surprising that few people in Mississippi know acquaintances who have contracted the virus.


